

Anyone working in a NOC is likely to hear statements like these:
- “Why are we always busy?”
- “I feel like we can never catch up,” or
- "My coworkers aren’t pulling their weight!”
The feeling of unrelenting busyness is pervasive in many, if not most, NOCs today. And it’s not surprising given the fast-paced nature of these operations and the constant multitasking required of staff.
The absence of actionable NOC metrics—and the visibility they provide—is one of the most common problems we see preventing support teams from breaking out of a constant state of busyness and all the problems that come with it. Metrics are instrumental in pinpointing where inefficiencies lie and what you can do to address them.
These measurements are also crucial for keeping staff morale high. People want to know how they’re being measured to see how they’re performing against their goals. Without the proper reporting, staff can feel lost.
In short, making the necessary investments to track the right metrics as often as you need to is more than worth the costs of the consequences of remaining in a state of partial blindness—and letting issues metastasize into more significant (and more expensive) problems.
For a quick self-evaluation on this point, ask yourself if you’re able to pull the following utilization measures from your reporting data right now:
- How much human labor is devoted to each edit of a particular type of ticket
- How many ticket edits are typically processed/performed per hour
- How many edits are typically made by time of day and day of week
In this guide, we explore the challenges NOCs encounter when tracking the right metrics and identify some specific measurements that just about every team should have in their dashboards.
Need help identifying which metrics your NOC should be measuring or configuring your environment to gather the data and insights you need to hit your efficiency and performance targets? Let’s talk NOC.
Clarifying a Few Terms: Metrics, KPIs, and SLAs
Before we jump into some actual metrics, let’s quickly level-set on terms. “Metrics,” “KPIs, and “SLAs” often get confused.
- A metric is any system or standard of measurement. There are hundreds of metrics a NOC could measure. Some are critical, others are interesting, and the rest are noise.
- A key performance indicator (KPI) is a specific metric that tells you something useful about your performance. Of all the metrics a NOC can measure, it should derive a handful of KPIs—those that offer actual measurements of performance that are important to end-users or customers.
- A service level agreement (SLA) is an expectation of a performance measure codified in a contractual agreement. SLAs specify the service, responsibilities, and service level targets. (Read our in-depth guide to NOC Service Level Management for more clarity on the various service level concepts and how to put them to use.)
The point here is that there are many, many metrics. Some are worth measuring; others are not. Some of those metrics are genuine performance indicators, and the performance targets required for any given business are established as expectations via SLAs.
Utilization Metrics—A Top Challenge for NOCs
Most NOC teams fixate on KPIs—the measures of how well they’re delivering service. First-touch resolution, for example, is an essential KPI for NOCs. How many incidents are resolved the first time they’re touched?
Rather than simply counting the number of resolved incidents in a given time, a KPI like first-touch resolution tells the NOC what’s actually important: how well the engineers can resolve the tickets they touch.
If you’re struggling to determine which metrics your team should elevate as KPIs, figuring this out boils down to asking which metrics truly reflect what matters most to your customers or end-users.

“Most customers don’t care how many tickets are open at any one time. They care about whether tickets are being resolved as soon as the engineers touch them. So the key performance indicators for a NOC are those that tell you what the customer cares about, or what end-users care about internally.”
— Prasad Rao, President & COO, INOC
While KPIs can certainly be a sore spot for many support teams, in our experience, there’s an even bigger metrics-related problem—one that, as we mentioned before, is often a complete blind spot for teams: utilization metrics.
These metrics reveal why the NOC is or isn’t busy at any point in time and how staffing levels should be set accordingly. It’s, in many ways, the key to efficiency.
Zooming out for just a moment, the idea of measuring “performance” is far too often thought of as external performance. “How well is our NOC performing for our customers or company?”
However, internal performance is just as important to measure. In our experience working with many NOC teams, this is simultaneously one of the biggest gaps—and biggest opportunities—in most operations. When NOCs start tracking and using these utilization metrics, they quickly see how much of a superpower they are for efficiency, specifically in the areas of staffing and operationalization. The fine-tuning teams can do as a result of having this information at their fingertips almost always directly improves their outward performance, too.
INOC’s Prasad Rao unpacks the value of utilization metrics even further:
“Many NOCs can get a decent handle on their KPIs. But utilization metrics are almost always a total black hole. Almost every time we go into a consulting engagement or assess the metrics a client gives us when we turn up outsourced support for them, we see this as both a giant gap and a giant opportunity.
Getting teams tracking and reporting on these metrics provides a ton of data to drive enhancements, whether we’re helping them run their operation better or we’re taking on support for them from our NOCs. Specifically, these metrics can tell you just about everything you need to know to staff and organize the NOC most cost-effectively. They also let you measure how each person in the NOC is performing against a benchmark. When you have these metrics you can start saying, ‘okay, this agent did 50 percent of what they ought to be able to do, or this agent did 150 percent’ and inform your decisions accordingly.
That kind of insight is what is missing in almost every NOC. Without it, teams are forced to throw resources at problems and spend a lot more money than they need to. Staff morale plays into this, too. Staff may not be happy because they don’t know how they’re being measured, and can’t work toward a goal. Most people want to know what success looks like for them so they can situate themselves to reach it. Without metrics like these, there’s just a lot of confusion and wasted money".
— Prasad Rao, President & COO, INOC
To quickly recap the problem and opportunity around metrics here:
- Many NOCs don’t adequately track and report on key utilization metrics.
- As a result, they remain more or less blind to opportunities to staff their NOC and organize it efficiently.
- Utilization metrics can provide individual-level metrics that help boost morale and enable people to proactively work toward reaching goals or performance benchmarks.
- Utilization metrics can also give NOC teams the data they need to staff their NOCs effectively and cost-effectively, enabling them to scale service.
3 Utilization Metrics Every NOC Should Be Measuring
Below, we identify some of these often-overlooked metrics and unpack them as much as we need to convey why they’re so impactful and worth measuring.
1. Labor content for each edit of a ticket
This utilization metric provides much-needed control over OPEX and morale in the NOC.
- Without it, teams are left to wonder whether their staffing levels are optimal or if they’re over- or under-staffed.
- Not having this metric can also lead to employee attrition, especially in an NOC that is chronically busy without a clear path out.
Remaining stuck in this situation can perpetuate a vicious cycle: Since leaders can’t investigate why everyone’s so busy all the time, staff may feel destined to burn out. Low morale can mean high churn, which only adds to the costs of filling those roles. And until those roles are filled, an understaffed NOC can ask even more of those who remain who still need to hit their SLAs. Metrics like this can be an important first step in breaking this all-too-common cycle.
Let’s linger on the mechanics of measuring the labor content for each ticket edit for just a minute. An incident's lifecycle is typically seen as starting when a ticket is created and presented to the NOC. After a certain amount of time, an engineer picks it up to work on the ticket. If it’s edited, resolved, and closed all in one touch, it’s deemed a first-touch resolution.
But a ticket often needs multiple touches before someone can resolve it. (Given the nature of the environments we support, for example, our average edits per ticket is somewhere in the neighborhood of 4.3 edits. More on this metric later.)
A real-life ticket lifecycle looks something like this:
- The ticket is created, picked up, edited, and assigned a status.
- It then comes back for another edit—and maybe another edit.
- It comes back to the NOC where it’s resolved.
Now, simply measuring the time from when the ticket was created to when it was resolved gives you what you need to calculate mean time to resolution. But that metric doesn’t measure actual utilization—how much human labor was actually spent each time that ticket was edited.
For example, let’s say a ticket was edited four times and each edit took 20 minutes. That’s a total of 80 minutes of labor content. Here’s where many teams misplace their focus: They conflate utilization with ticket duration, when in fact, that duration isn’t measuring the labor content spent on that ticket because of the time that exists between edits while the ticket remains open.
If, for example, you have an average labor content of 20 minutes per ticket, and you have 1000 tickets, you can now extrapolate the real labor needs and think more precisely about how you need to staff your NOC.
In short: measuring the labor content for each edit of a ticket gives the NOC a precise and accurate measurement of the work devoted to the lifecycle of a ticket rather than settling for ticket duration as an imperfect (and often recklessly inaccurate) proxy.
2. Number of edits processed/performed per hour
This metric simply measures how many edits in the ticket lifecycle a person can perform per hour.
These first two metrics are somewhat related because, for example, if the labor content for a particular ticket type is 15 minutes, you can reasonably expect to handle a maximum of four per hour (at 100% efficiency).
Like the other utilization metrics we identify here, their usefulness isn’t so much in examining them one by one, but as components that work together to paint a much bigger picture of utilization. When you can paint such a picture, you can spot opportunities to fine-tune your operation in ways that would have been hard, if not impossible, to see otherwise.
3. A heatmap of edits by the time of day and day of week
This is perhaps the most important metric for making staffing decisions, specifically helping teams answer the burning question: How do I know how many people to have in the NOC at a certain time?
- A well-designed heat map will tell you, for example, that at 8:00 a.m. on Mondays, you should expect to work up to 60 tickets.
- Now, combine this with the previous metrics, and you can get even more precise: On Monday mornings at 8:00 a.m., I can expect up to 60 tickets, each with four edits taking 20 minutes.
Now the utilization picture starts to emerge. You can start figuring out optimal staffing levels at certain times of the day without relying on costly assumptions.
Using these utilization metrics together
It’s important to emphasize that the real superpower a team can gain from measuring its utilization isn’t tracking these metrics separately but using them together, holistically.
Here at INOC, we help teams put the necessary pieces in place to start gathering this data (if they aren’t already) and then take it a step further to extract incredible levels of insight from them—insights that directly inform how to staff and organize a NOC for peak performance and efficiency.
That process involves using some statistical modeling to determine exactly how much human labor—and therefore staff—is needed by shift and time of day, which is the ultimate output teams need.
Needless to say, that modeling is a little too complicated and situation-specific to address in a blog post responsibly. But we help NOC teams capture and use these metrics to do this all the time.
If you think your team could benefit from better metrics and may need help defining that benefit or setting up the requisite technical components to track them, let’s talk NOC! Express your interest in a NOC consultation, and we'll follow up within one business day to schedule a time to connect at your convenience.
A Few NOC KPIs That Often Get Ignored
While utilization metrics are by far the biggest challenge for most NOCs, figuring out the right KPIs to track can also be a struggle. Here are some that are missing or poorly configured a lot. (These are not the only KPIs NOCs need to measure!)
1. Time to Impact Assessment
This KPI is often missing despite being so important for most NOCs’ customers or end-users. Without it, teams can’t track and improve the speed at which they deliver outage impact information to those who need it most. In most cases, CSMs will come to the NOC with questions like, “why did it take 45 minutes before you told me my site was down?”
Customers or end-users want to know about infrastructure outages as soon as possible. Most teams track how long it takes for the NOC to notify customers or end-users that there’s an outage. But that’s trivial information. What’s actually important is explaining the impact of that outage—as quickly as possible. “I realize there’s an outage. Now, how many sites were affected?”
While teams eventually get around to doing this, they rarely track how fast they do it over time. When they do, they have the insights they need to fine-tune their processes to continually improve and make that time shorter.
Since most teams want to automate as much of this process as possible, the technical requirements of tracking time to impact assessment can get a little complicated. It’s an absolute necessity to have a well-managed configuration management database or CMDB. This database allows for quick manual or automated lookup of impacted services when an outage occurs. With this information in quick reach, lookups are lightning-fast and can be attached and sent out with tickets.
📄 Grab our free white paper for more practical insight on operationalizing critical components like a CMDB in your operation: A Practical Guide to Running an Effective NOC.
2. Update Frequency
Update frequency measures how quickly a NOC engineer is following up on a ticket during an outage.
For example, imagine a ticket is created and assigned to an engineer to work and resolve. Depending on the many factors that determine how that person prioritizes that ticket, they may start working it immediately or not. But it's the NOC’s job to be persistent in reaching out to impacted parties to gather information and update the ticket with findings.
Update frequency essentially measures the time interval between edits. Are you updating people every hour? Two hours? Four hours?
Many teams track the total amount of time to restore and first notification. But they don’t track how frequently the NOC is following up. Tracking this is important both from a customer experience perspective and for fine-tuning your processes to reduce time to restore. (It’s hard to know how to improve without performance data like this.)
Setting up your tools to track this metric most often boils down to configuring your ticketing system to record and present that data usefully.
3. Priority 1 NOC Mean Time to Resolve (MTTR) and NOC Mean Time to Restore
These are crucial performance indicators for handling Priority 1 incidents. Our benchmark target is under 4 hours.
These incidents significantly affect operations, and swift resolution and restoration are essential. Effective strategies include identifying and addressing the most probable causes of incidents first. While the true MTTR might be influenced by external factors, the NOC Mean Time to Restore is a controllable performance measure. Understanding these metrics and prioritizing Priority 1 incidents are critical for operational efficiency.
4. Tier 1 NOC Incident Resolution Rate
This KPI measures the percentage of incidents the Tier 1 support team can resolve without escalation. Our benchmark target is 60-80%.
This metric reflects the team's capacity to handle a variety of incidents independently and efficiently. A high resolution rate at the Tier 1 level indicates a proficient frontline defense and efficient operations. Lower resolution rates can lead to escalations, increasing costs and resolution times, potentially impacting customer satisfaction. Regular training and a well-defined escalation process can enhance Tier 1 performance.
5. Average Staff Tenure in Position
This is a significant indicator of staff stability and satisfaction within the organization. Lower turnover indicates a positive work environment, high employee satisfaction, and contributes positively to overall NOC performance. Our benchmark target is over 1 year.
High turnover can have tangible (recruitment and training costs) and intangible (loss of organizational knowledge and expertise) costs. By cultivating a positive work culture, offering competitive pay, and fostering opportunities for professional growth, organizations can increase average staff tenure.
6. SLA Compliance
The SLA Compliance benchmark focuses on maintaining a high adherence to Service Level Agreements, reflecting a company's commitment to consistent service delivery. Meeting SLAs is essential for preserving client trust and satisfaction. Failure to do so can tarnish the company's reputation, lead to financial penalties, and dissatisfaction among clients.
INOC achieves a 95% SLA compliance rate monthly by rigorously monitoring performance metrics, implementing robust operational processes, and refining our service delivery model. This level of compliance is delivered through a shared model designed to balance cost and efficiency while maintaining high-quality services.
7. Mean Time Between Failures (MTBF)
The MTBF is a key measure of network reliability and stability. A consistent increase in MTBF over time signals a strengthening of the network, implying improved operational efficiency. Network failures can lead to significant business disruptions, affecting customer satisfaction, potentially causing reputational damage, client attrition, and revenue loss. Therefore, consistently increasing MTBF is critical.
However, not all NOCs can measure MTBF due to their network environment and external forces that may impact network performance. INOC, where possible, strives for an upward trend in MTBF by continually enhancing network architecture, enforcing robust redundancy protocols, and proactively addressing potential vulnerabilities.
8. Priority-Based NOC Time to Action
This metric evaluates the speed at which an incident is detected and the initiation of remediation. We aim for an average under 15 minutes per month.
Fast initial responses are vital for swiftly mitigating issues and reducing their impact on operations. Delayed responses can prolong downtime and reduce productivity, affecting customer satisfaction. INOC achieves this benchmark by employing advanced monitoring tools, maintaining a prepared NOC team, and using efficient alert systems. We prioritize incidents to ensure critical incidents receive immediate attention.
9. Mean Time to Detect (MTTD) incorporating Network Impact and Priority
MTTD measures the agility of a NOC in identifying operational issues, aiming to detect incidents in under one minute. Quick and accurate detection leads to faster resolution, reduced downtime, and improved customer satisfaction.
Extended MTTD can increase incident resolution times, increasing downtime and lowering customer satisfaction. INOC maintains this benchmark by using advanced monitoring tools, efficient alerting systems, and a highly trained workforce. We use AIOps to analyze alarms and initiate new incidents, helping engineers strategize an appropriate response and trace an incident's origin.
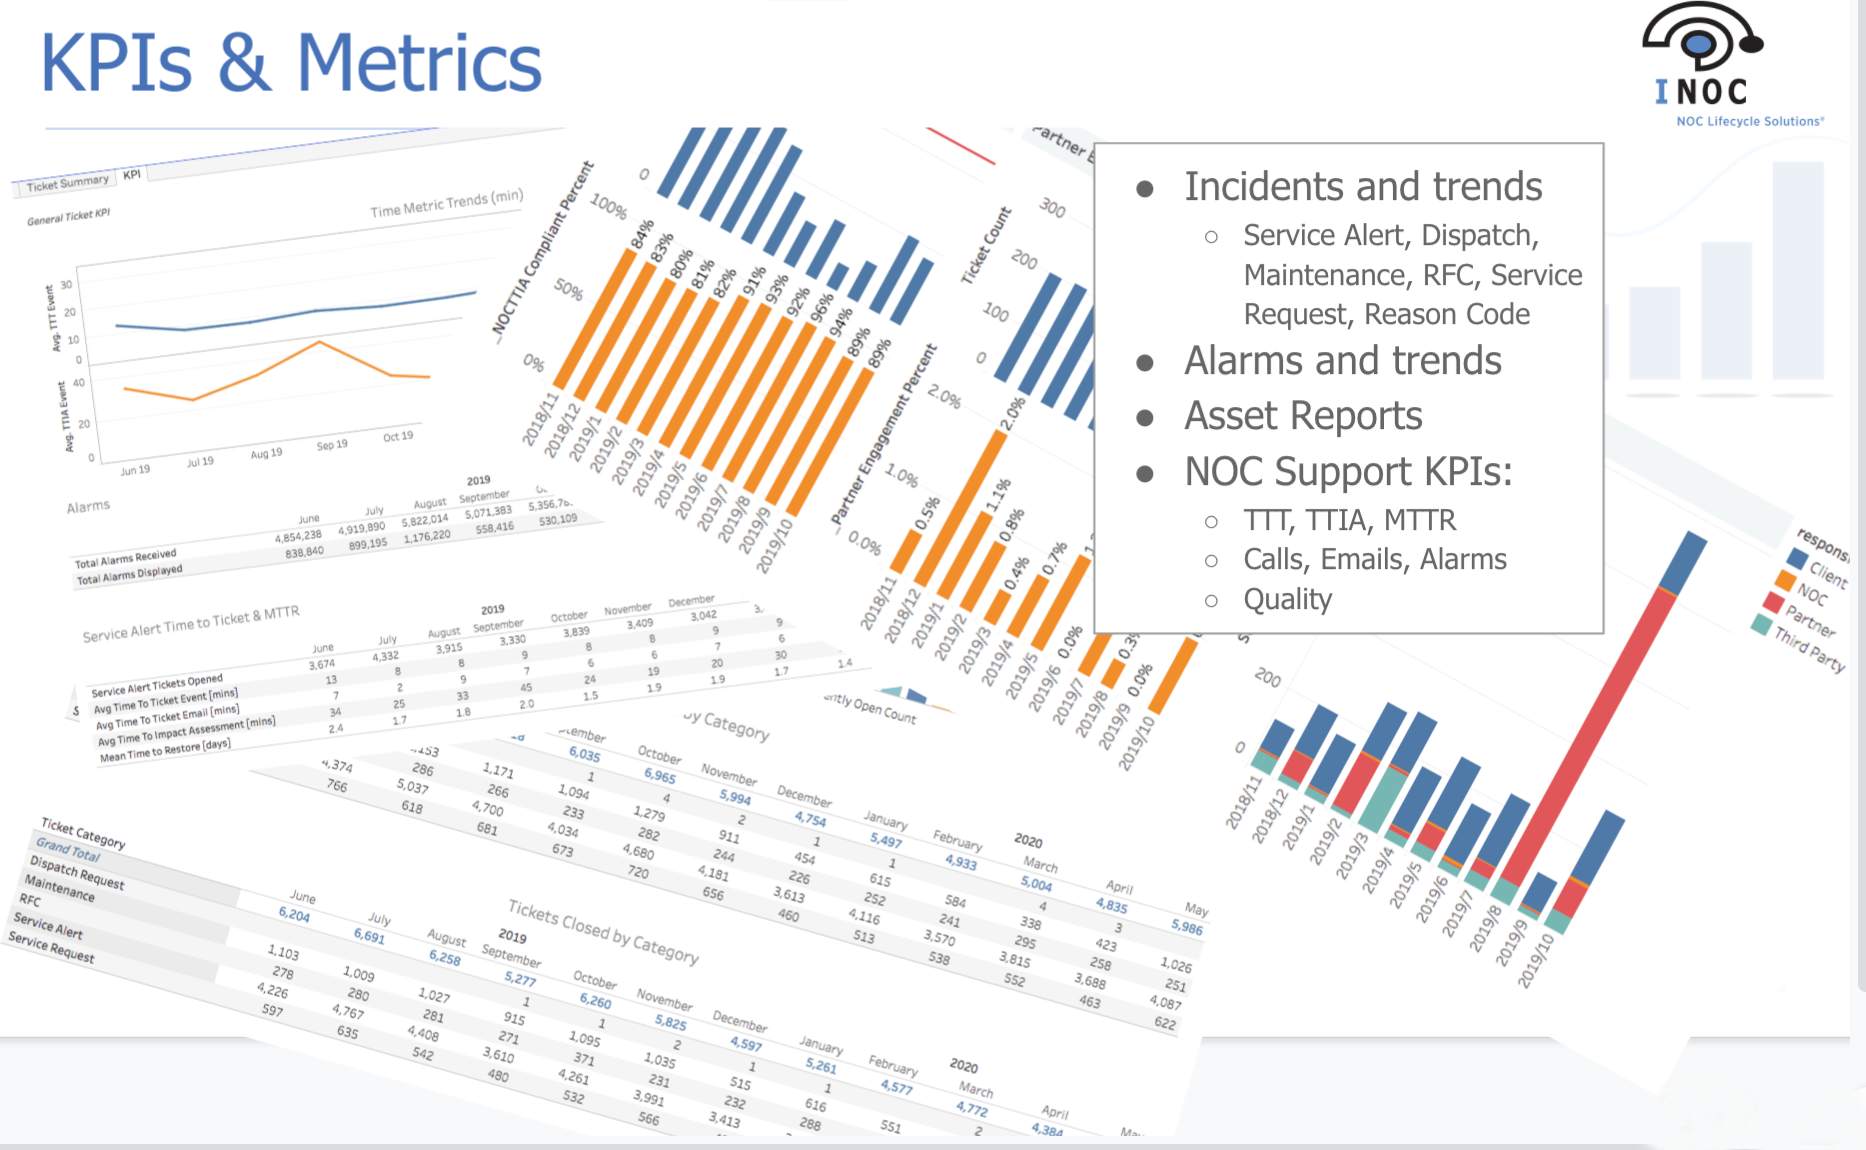
A Quick Breakdown of Critical NOC Metrics/KPIs
| NOC KPI | Description |
|
Alarms Received |
The total number of alarms the NOC receives from the client’s equipment under management. This includes events that are filtered out, such as informational alerts and alerts that are requested to be filtered out as non-actionable. |
| Alarms Displayed |
This is how many alarms of the total alarms received are displayed to the NOC for taking action. Displayed alarms are either ticketed, associated with existing tickets, or are quick flaps that didn’t warrant a ticket. |
| Service Alerts: Avg Time to Ticket Events (Time to Notify) |
This measures the duration from receiving an actionable event in the NOC's systems to when the NOC issues a notification (via email, SMS, or auto-call) to the client or customer. This event should initiate an Incident record in the ticketing system. |
| Service Alerts: Avg Time to Ticket Email (Time to Notify) | Tracks the time from receiving an email in the NOC’s system to when a notification is sent to the client or customer. The receipt of the email leads to creating an Incident in the ticketing system. |
| Service Alerts: Time to Impact Assessment | Defines the period from Incident creation in the ticketing system to when the NOC isolates the probable cause, impacted services, and action plan. |
| Service Alerts: Mean Time to Restore | The average time taken to restore or repair services based on Service Alert/Incident tickets within a month, calculated from the alarm report to clearance. |
| Mean Time to Close | The average duration from ticket creation to closure, covering all activities related to resolving the ticket, both by the NOC team and external parties. |
| Inbound Calls: Received | Total incoming calls to the NOC on the dedicated line(s) for your service, encompassing all assigned lines. |
| Inbound Calls: Calls Abandoned (>2 Min) | Total calls where the caller hung up without leaving a message after waiting for 2 minutes or longer. |
| Inbound Calls: Average Answer Time | The average time taken by the NOC to answer calls on your dedicated line(s) over a month. The standard service level agreement (SLA) target is within 60 seconds. |
| Inbound Calls: Max Answer Time | The longest wait time for the NOC to answer a call on your dedicated line(s). Our general SLA target is within 10 minutes. |
| QA: Submitted Tickets | The total count of Quality Assurance tickets a company sends to the NOC service provider. |
| QA: Quality Approved | The total number of your submitted QA tickets that INOC has responded to with approval. |
Putting Metrics in Convenient, Actionable View
 Measuring these metrics is one thing. Reporting on and visualizing them is another. NOCs often collect data from multiple sources and struggle to connect the dots.
- The ticketing system has a database.
- Email is another database.
- Alarms are another database.
- Maybe phone calls are another database.
Most NOC managers aren’t equipped to pull those disparate data sources together into a single dashboard or visualization—one “single pane of glass.”
The solution here can look different from one organization to another. Still, generally, it boils down to ensuring you have data properly warehoused and are equipped with a reporting engine capable of collecting, analyzing, and displaying that data so it’s actionable. (Tools here include Power BI, Tableau, and Cognos.)
Read also: NOC Tools and Software: An Operational Perspective
Systems like these collect disparate data sources so teams aren’t constantly system-switching from, say, the ticketing system’s native reporting engine to the phone reporting system and struggling or completely unable to make connections between them.
A third-party tool can take all of those sources, analyze data across them, and present it in a single pane. Convenient, rich reporting like this can have an immeasurable impact on efficiency morale, and overall performance.
Take the First Step Toward a More Effective and Efficient NOC
In addition to providing award-winning 24x7 infrastructure monitoring and support, we deliver comprehensive best practices consulting for designing and building new NOCs and helping existing NOCs significantly improve the support provided to their end-users and customers.
Our NOC experts work closely with teams to identify and analyze operational gaps, highlight opportunities, and develop a standardized operational framework to push IT service performance and availability into high gear.
Whether your challenges lie in metrics and reporting or elsewhere in your operation, we take the time to understand what's working, what's not, and craft a customized blueprint for tiered organization and service operation.
Learn more about NOC services and schedule a NOC consultation with our Solution Engineers to start the conversation.
Want to learn more about managing metrics in the NOC, and many other best practices for running a NOC at peak performance? Grab our free white paper below.
Free white paper A Practical Guide to Running an Effective NOC
Download our free white paper and learn how to build, optimize, and manage your NOC to maximize performance and uptime.


-images-0.jpg?height=2000&name=ino-WP-NOCPerformanceMetrics-01%20(1)-images-0.jpg)


-images-0.jpg?width=200&height=259&name=ino-WP-NOCPerformanceMetrics-01%20(1)-images-0.jpg)
