
In case your time is short
- Expanded Scope of Network Monitoring: Modern enterprise monitoring strategies now encompass not only network components but also cloud computing, infrastructure, applications, and security.
- Centralization and Complexity: Networks have become more centralized yet multifaceted, posing challenges in monitoring due to the complexity of infrastructure location and integration of various monitoring tools.
- Security and Monitoring: Security is a top priority in network monitoring, with recent high-profile incidents highlighting the need for robust measures to ensure data safety.
- Protocols Knowledge: Understanding a wide range of monitoring protocols beyond SNMP, such as APIs, gNMI, and WMI, is crucial for effectively monitoring modern networks.
- Data Integration and Insight Generation: Successful monitoring involves marrying disparate data points to generate actionable insights, helping in identifying urgent problems and long-term trends.
- Effective Reporting: Building reports that offer genuinely useful insights and integrating them into appropriate workflows is essential for operational efficiency.
- Single Pane of Glass Approach: Implementing a single pane of glass for monitoring helps overcome organizational silos and enhances coordination across different departments.
- Meeting SLAs: Tuning monitoring systems to appropriately filter out noise and meet SLAs is critical; this may involve adjusting thresholds to better reflect the actual needs of the environment.
- Utilization of AIOps: Leveraging AIOps tools can greatly enhance the efficiency of monitoring processes by automating data analysis and event correlation, reducing alert noise, and improving response times.
- Customizing Monitoring Strategies: Tailoring monitoring strategies to fit the specific demands of the environment ensures that the monitoring program is effective and relevant.
Today, “network monitoring” has largely outgrown its title. Network components, cloud compute, infrastructure, applications, and security all have to be part of a modern enterprise monitoring strategy.
Setting aside the security component, which deserves its own conversation, perhaps the biggest monitoring challenge today is understanding exactly where the infrastructure lies and how to operationalize a monitoring program to protect it.
Until somewhat recently, as SD technologies like SDN and SD-WAN, as well as cloud computing services like AWS, were becoming more prevalent, the popular trend was to use someone else’s data center and let them manage it, which itself could be a challenge.
Today, it’s relatively easy to migrate, for instance, your compute infrastructure to the cloud and optimize endpoints to more effectively manage traffic—all with lower management and overhead costs. But these advancements have complicated the monitoring question at a fundamental level. What exactly do you need to monitor, and how do you need to monitor it?
Here, we provide some context around these questions and identify a few of the essential components of a successful enterprise monitoring program in 2026.
Get in touch with us to apply these questions to your IT service environment and see where expert NOC support could help enhance your monitoring program and maximize uptime and performance.
The Challenges of Enterprise Network Monitoring in 2026
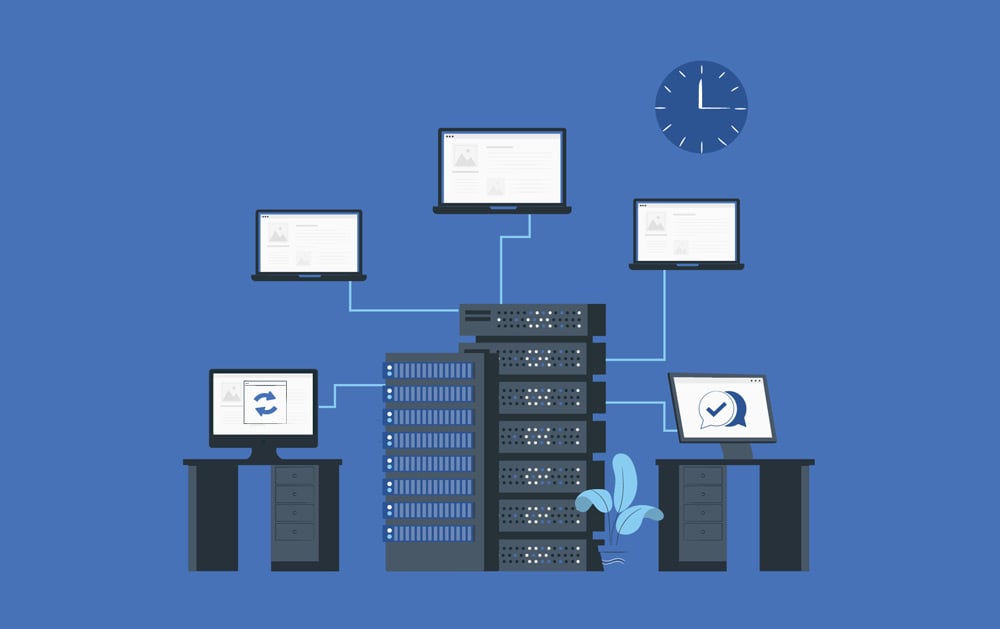
One of the primary root causes of today’s monitoring challenges is the fact that networks have become simultaneously more centralized and multifaceted.
Our NOC platform’s evolution is a testament to this. It combines AIOps Platforms, ITSM Ticketing Platforms, Monitoring Platforms, and other tools. Some of those tools exist on the cloud, some as Software as a Service (SaaS) platforms, while other components exist on INOC-owned hardware in data centers with networking components supporting them.
The questions become:
- How do we monitor those effectively? How do we get an eye on those elements?
- Where is the platform actually located, and how does everything tie together?
The same challenges and questions now apply to the explosion of cloud-based solutions. Everything has become more centralized and, with that, much more compact. Multiple pieces are stacked on top of each other in a condensed area—forcing teams to recalibrate their approach to monitoring in ways that aren’t always obvious.
While this evolution has generally made things easier for operators, that ease has come at the cost of complexity to those in charge of monitoring. How do you maintain the same level of visibility into all of this and continue to meet and exceed SLAs?
Security, as we mentioned before, is the other fundamental challenge. Recent high-profile events have only sharpened security concerns—often bumping them to the top of the priority list in any discussion around monitoring. The core question is almost always the same: how can we ensure our data is safe and secure?
This is a question we’ve been addressing a lot these days. Talk to us if you’re searching for a monitoring solution that offers safety and security.
In this guide, we focus on the non-security side of monitoring—the operational components that are no less important but often overlooked and undervalued. While this list is by no means exhaustive, we identify five components that are common, important, and widely applicable to enterprise and service provider monitoring environments.
1. A Mastery of the Protocols Required for Modern Network Monitoring
These days, the importance of understanding protocols can’t be understated. Monitoring is more than just SNMP, especially at the enterprise and service provider levels. It requires a thoughtful approach that considers much more.
Depending on the tools or applications in question, monitoring requires looking at several different protocols, including those from APIs, gNMI, and WMI. Not to mention, if you’re monitoring, say, a web server and want to validate the end-user experience, you’ll likely need to make synthetic transactions to emulate that experience.
If you’re monitoring a database, you’ll need to be able to run queries and emulate that experience as well—ensuring transactions are applied successfully to, for instance, an SQL server.
The bottom line is that a vast array of variability around monitoring protocols requires careful deliberation.
2. The Ability to Marry Disparate Data Points and Distill Practical Insights from Them
This point dovetails perfectly with the previous one. Effective monitoring is more than just detecting and addressing incidents. It's understanding what's going on at a deeper level.
Once teams master the complexity of all the components in their network, they must marry those disparate data points and distill their indications—identifying and diagnosing both urgent problems and long-term trends that need to be addressed.
What are you doing with the data you’re getting from things like gNMI, for example? How are you combining those data points to make correlations and understand what those correlations mean?
When we bring a new device or technology into our monitoring environment here at INOC, for example, we spend a lot of time understanding exactly what data we’re getting and what it’s telling us.
- "What are all the ways we can use this data?"
- "What is the best way to determine what is genuinely incident or problem-worthy?"
The answers to these kinds of questions help us establish which trends to start paying close attention to and which specific support solutions to start prescribing. For example, is a trending issue we’re seeing best dealt with through Problem Management, or is what we’re seeing indicative of a change happening across the system, and thus best addressed through Change Management?
3. Reporting That Offers Genuinely Useful Insights Into Your Data
The third piece in this sequence is reporting and acting on the monitoring data. Now that you know exactly what to monitor, how best to monitor it, and how to synthesize that information into something appropriate and actionable, it’s time to focus on building reports that communicate that information as clearly and concisely as possible and route it to the appropriate workflow.
- “What information should be ported to drive our incident flow?”
- “What reporting data should drive Problem Management?”
These questions should help you take prescriptive action based on the diagnoses you’re making with the data you collect and analyze.
From an incident perspective, for example, how exactly are you ticketing from events you’ve deemed incident-worthy? Does your ticketing volume reflect the actual incident volume?
"I've seen a couple of different strategies platforms take that offer automatic ticketing on events. While this seems like a time-saving convenience, it actually creates a huge operational problem for a lot of organizations. Instead of correlating events—combining events into one ticket—these platforms cut a separate ticket for each event. At the end of the day, it becomes a self-inflicted operational problem with many tickets to one incident. You end up spending your time on a ticketing platform trying to combine and make sense of it instead of being able to clearly see the real incident flow."
— Ben Cone, Former Solutions Engineer, INOC
Event correlation is one area where the machine learning powering today’s AIOps tools genuinely delivers on the hype. Here at INOC, for example, we’ve strategically integrated AIOps into our event monitoring and management processes to take on the heavy data analysis workload of event correlation and unlock a whole new level of efficiency.
With data collection and analysis capabilities orders of magnitude greater than even a large human team, AIOps aggregates data from multiple data sources and technology areas to provide a central data collection point. It then analyzes this data incredibly quickly and accurately determines when multiple signals across multiple areas indicate a single issue. The resulting reduction in alert noise focuses on alerts that require action and helps reduce Time to Impact Analysis and Mean Time to Repair. Events can then correlate with configuration changes, allowing for quick root cause determination.
It’s important to note that this is not the only area AIOps is helping NOCs perform better and more efficiently. Grab our free white paper, The Role of AIOps in Enhancing NOC Support, to learn how these tools are giving NOCs a competitive edge in other support functions as well.
In addition to new tools for driving workflows in the NOC, reports themselves need to reflect the needs of the modern network. Our availability reports are a prime example of how thoughtful reporting can be critically important in areas like optical monitoring. These reports give us highly granular insights into even the most minute incidents, such as unavailable seconds, errored seconds, and severely errored seconds—any “blip.”
Being able to detect and report on one errored second can prompt a number of questions and result in a number of different actions that can prevent bigger problems down the road. This level of granularity has become increasingly desirable in areas like optical, where environments are hypersensitive to even the smallest changes.
4. Developing and Maintaining a “Single Pane of Glass” Within Your Monitoring Environment
The single pane of glass concept is nothing new, but it has become increasingly important for monitoring, especially in sprawling enterprise or service provider environments.
These organizations often have dedicated departments for web applications, DevOps, databases, infrastructure systems, and networks. When an operational problem arises, the silos between these groups can prevent much-needed coordination at a fundamental level. Different groups look at the problem through the lens of different tools, arriving at predictably different results. The similarly predictable finger-pointing then ensues, all to the detriment of the business.
A single pane of glass monitoring approach inoculates against many of these common organizational challenges. Such a system effectively incorporates points one through three in our list above and gives that information one place to live where everyone can see and act on it together.
Here at INOC, our platform is designed specifically to install that single pane of glass no matter how complex or disparate the environment is.
5. Interpreting Data in Service of Meeting (and Exceeding) SLAs
Many teams still struggle to interpret their data because their monitoring consistently fails to meet their SLAs and other mandates. This situation is usually the symptom of one of two deeper problems:
- Their monitoring has not been tuned to filter out noise appropriately. As a result, critical alerts get lost in the background of noise.
- Their monitoring has not been tuned to the appropriate protocols. See point number one in the list above. Here, the monitoring team doesn’t understand the protocols they need to monitor or they don't have the right tools to monitor them. Sometimes, it’s a combination of both.
No matter which problem is to blame, the outcome is the same: missed events and, thus, missed SLAs. Delays and problems stemming from these frictions can have enormous costs. Internally, this can translate to a loss of revenue. Externally, it can impact your customers.
A poorly-tuned monitoring system is a problem we’re approached to solve a lot. Often, the first step involves an alarm analysis. We take a week or two of alarm data and ask the tough questions. What does this alarm data mean? What do you want people to do with this data?
The answers to these questions guide our operational decisions about the data you do and don’t want to feed to the NOC based on actions that need to be taken. For data that amounts to noise, how can we develop a filtering strategy to deal with it and keep our focus on what matters?
One of the most common problems in this area is unchanged default thresholds. We often find that the threshold or SLA settings within a monitoring tool haven’t been fine-tuned to the environment they’re monitoring. Very rarely do out-of-the-box thresholds happen to match the unique needs of an environment.
"Many times, we’ve seen SLAs or default thresholds of maybe 80% for memory or 80% for CPU. This will present a torrent of alarms and tickets, and it’s not until you question those thresholds that you realize they can be set to 90% or 95%. Almost instantly, that ticket volume drops dramatically."
— Ben Cone, Former Solutions Engineer, INOC
The takeaway here is simple: adjust threshold values—whether in a piece of gear or in the NMS platform—to be meaningful and reflect the environment’s sensitivity to change, whether that means raising or lowering them to fit.
Final Thoughts and Next Steps
While this list identifies a few specific components important to modern network monitoring, the high-level takeaway is to take the time to step back and understand what is demanded of your monitoring program and tailor a monitoring strategy to fit it perfectly.
Here at INOC, that approach is baked into how we approach NOC support, no matter where support is needed. When monitoring, especially among enterprises and service providers, an out-of-the-box NMS rarely happens to fit as it should. We help teams get the operational support they need to reveal and act on those opportunities—whether helping them through expert NOC consulting or taking on outsourced NOC support ourselves.
Our NMS can receive event data and poll your infrastructure elements—network, cloud, and applications—using a variety of mechanisms and protocols. Whether you need direct monitoring or want us to integrate current monitoring tools, we seamlessly connect the INOC Platform to your infrastructure or your tools so alarms flow freely to us. Learn more about our NMS and the other components of the INOC Platform here.
Want to learn more about the tool and process advancements you can use to improve network monitoring and other NOC functions? Grab our free AIOps white paper and contact us today to see how we can help you improve your monitoring and larger IT service strategy.
A Brief Introduction to INOC's Ops 3.0 Platform
INOC's Ops 3.0 Platform is transforming NOC service delivery. Ops 3.0 is the third major iteration of our NOC service platform, serving as a comprehensive operating system for technology, operations, and service delivery. It enhances NOC service delivery by automating alarm feed ingestion, correlation, and ticketing, increasing accuracy and speed while minimizing human delays.

- Automation and AIOps: The platform utilizes AIOps (Artificial Intelligence for IT Operations) to automate the ingestion, correlation, and ticketing of alarm feeds. This automation enhances NOC service delivery by increasing accuracy and speed and reducing human intervention.
- Key Features: Features include automated alarm correlation, incident automation, a self-service client portal, auto-resolution of short-duration incidents, and a secure multi-tenant architecture. These capabilities ensure rapid incident response, cost savings, and high availability.
- Integration and Efficiency: Ops 3.0 integrates seamlessly with various NMS and IT ITSM tools, leveraging a robust CMDB and automated workflows to expedite incident management—simplifying and speeding up the process.
- Structured NOC Approach: An Advanced Incident Management team within the structured NOC ensures effective incident resolution and optimal resource allocation. The onboarding process is customized to align the platform with clients' unique operational needs for seamless integration and service.
- Outcomes: Implementing Ops 3.0 has led to significant operational improvements for clients, including increased incident auto-resolution rates, reduced major escalations, and streamlined processes for customer onboarding and network operations.
Free case study How INOC Partnered with SDI Presence to Reduce Ticket Volume by 50% and Increase Monitoring Accuracy by 25% for Critical Infrastructure Customers
Download this case study and get all the technical details of this engagement.


-images-0.jpg?height=2000&name=ino-WP-NOCPerformanceMetrics-01%20(1)-images-0.jpg)


-images-0.jpg?width=200&height=259&name=ino-WP-NOCPerformanceMetrics-01%20(1)-images-0.jpg)
